Watching your PAC file decide
Two users couldn't reach a site. Same policy, same PAC file, same OS, same browser version as everyone else. Everyone else was fine. Those two got a timeout.
The site had exactly one working path: a local SOCKS proxy on a custom port, tunneling the connection out over another medium. Miss that listener and the traffic goes nowhere.
It took me a while to find. The tool that found it took about thirty seconds.
what I tried first
- Proxy logs on the workstation. Traffic was being handled. Nothing explained why these two machines were different.
lsof. The local proxy was listening. Port open, process up. So the tunnel worked and something wasn't handing traffic to it.tcpdump. Not seeing what I expected. But a capture shows what left the machine, not why the browser picked that path.- DevTools. Chrome is supposed to show you the remote address and port. I couldn't find it. For a connection that never establishes there's almost nothing to show, and nothing at all about proxy selection. DevTools shows you the request, not the routing decision before it.
All four show you what happened after the decision. None of them show you the decision.
my own tester didn't find it either
I built the PAC tester on this site, so
I'll say this plainly: it was no help here, and no tool running in my
browser could have been. It simulates dnsResolve,
because it makes no network calls. It can tell you a branch depends on
DNS. It can't tell you what DNS returned on someone else's machine.
That was the bug. The file was fine. The logic was fine. The input was
different.
It would have flagged the guilty line, though. Its linter warns on
dnsResolve, isInNet, and
isResolvable, and says to keep those calls as low in the
file as possible. That warning was pointing at the rule that broke us
months before I went looking. I'd have read it as advice about
performance.
the rule at the top
chrome://net-export logs what Chrome's network stack
actually did, including every PAC evaluation. I loaded the capture and
the answer was right there: the PAC was bypassing the proxy for this
destination. Not failing. Not erroring. Taking a branch I hadn't thought
about.
The file resolved every hostname to an IP, checked whether it was RFC 1918, and if so routed it over the VPN instead of the proxy. That's a normal thing to do. Internal-looking traffic goes the internal way.
It breaks when the destination's only working path is a local tunnel. Resolve, get a private address, take the "don't proxy" branch, never reach the SOCKS listener, time out. No error, because nothing went wrong. The file did what it said.
function FindProxyForURL(url, host) {
    // resolve everything to classify by address space
    var ip = dnsResolve(host);

    if (ip && isInNet(ip, "10.0.0.0", "255.0.0.0")) {
        return "DIRECT";
    }
    if (ip && isInNet(ip, "172.16.0.0", "255.240.0.0")) {
        return "DIRECT";
    }
    if (ip && isInNet(ip, "192.168.0.0", "255.255.0.0")) {
        return "DIRECT";
    }

    // dead for anything that resolved private — including the tunnel rule
    return "SOCKS5 127.0.0.1:1080";
}
Everything under that block is unreachable for a host that resolves private. The tunnel rule was under the block.
why only two users
I never confirmed this one. Same OS, same browser, same policy, same
file, and the bypass only hit two people. It comes down to what
dnsResolve returned on those machines, but I couldn't prove
the mechanism.
My working theory at the time was split-horizon DNS. The users who were fine got an answer outside RFC 1918 space — a public address, or no answer at all — and either one falls through the private-IP block to the tunnel rule below. The two who broke got the internal address, matched the block, and got bypassed. A different resolver, VPN state, a stale cache entry, or a different network segment would all do that. Treat it as a theory, not a conclusion.
The fix didn't depend on knowing. Once I could see which branch fired, I restructured the file so the outcome was right for everyone regardless of what DNS said. You don't always get the root cause. You do need to see the decision.
"it works in curl"
curl has no PAC support. It won't fetch a PAC file and
it won't evaluate one. It honors http_proxy /
https_proxy or an explicit --proxy, and that's
it.
Exception: a full device tunnel. If the machine runs Zscaler Client Connector with a full device tunnel — Z-Tunnel 2.0, or a GRE/IPSec network tunnel — forwarding happens at the OS network layer. All TCP/IP traffic is captured, so curl goes through Zscaler transparently with no proxy configuration at all. That's why curl followed the policy in my case. (Zscaler: choosing traffic forwarding methods)
So "it works in curl" isn't a clean test. On an unmanaged machine it only tells you the destination is reachable when you skip PAC. On a managed one, curl may be getting forwarded by something below it. Either way it isn't the browser's decision.
capturing a log
Do this on the machine with the problem, as the user with the problem. When the bug is "this machine's DNS answers differently," that's the only step that matters.
- Open
chrome://net-export/. - In another tab open
chrome://net-internals/#proxyand click Re-apply settings and Clear bad proxies. Chrome routes around proxies that failed earlier — skip this and you may capture the fallback instead of the real decision. - Back on net-export, click Start Logging to Disk. Leave the options alone — the default, Strip private information, is the one you want.
- Reproduce the problem.
- If you can, load a URL that works too. A good decision next to a bad one is the fastest way to spot the difference.
- Click Stop Logging.
Keep it short. Start, do the one thing, stop. Four minutes of background tab noise is a log you won't read.
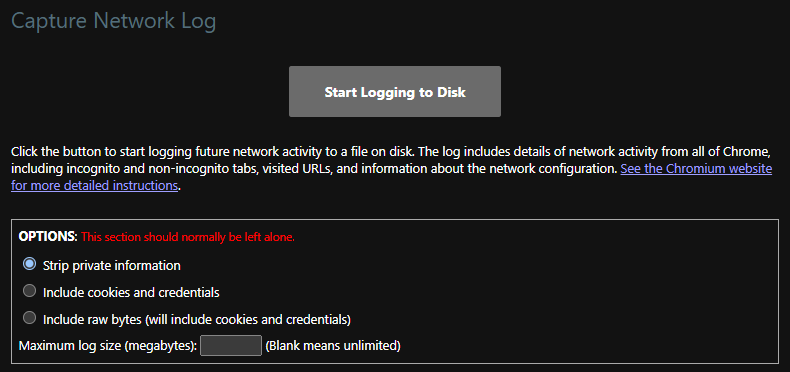
what's in the file
You don't read a NetLog directly. It's one big JSON document that starts with dictionaries mapping numbers to names, then a long list of events that reference those numbers:
{
  "constants": {
    "logEventTypes": {
      "HTTP_STREAM_JOB_CONTROLLER_PROXY_SERVER_RESOLVED": 176,
      "PAC_JAVASCRIPT_ALERT": 213,
      "PAC_JAVASCRIPT_ERROR": 214
    }
  },
  "events": [
    {
      "params": { "message": "dnsResolve(portal.corp.example) = 10.14.22.9" },
      "phase": 0,
      "source": { "id": 402, "type": 18 },
      "time": "84119353",
      "type": 213
    }
  ]
}
Example log, not a real capture. The numeric IDs change between Chrome versions — look yours up rather than copying these.
Note the "type": 213. There's no event name in the event.
You look 213 up in logEventTypes to find out it's a
PAC_JAVASCRIPT_ALERT. Now do that across tens of thousands
of events. That's what the viewer is for.
reading it in the viewer
Load the file at netlog-viewer.appspot.com. Two things worth knowing before you drop your browsing history into a web page:
appspot.comis Google's App Engine domain. The viewer is part of Catapult, a Chromium project, deployed there by the project admins. It's Chromium's own tooling, not a third-party site that parses Chrome logs.- It parses client-side, in your browser. The log isn't uploaded.
If your policy still says no, you can run the viewer locally from the Catapult source, and Fiddler can import NetLogs on Windows.
Open the Events tab and filter. Most of what you want
has PROXY_, PAC_, or WPAD_ in the
name. Three are worth knowing:
HTTP_STREAM_JOB_CONTROLLER_PROXY_SERVER_RESOLVED— the proxy Chrome picked. The verdict.PAC_JAVASCRIPT_ALERT— anything your filealert()ed.PAC_JAVASCRIPT_ERROR— your script threw. Usually a typo or a bad return string.
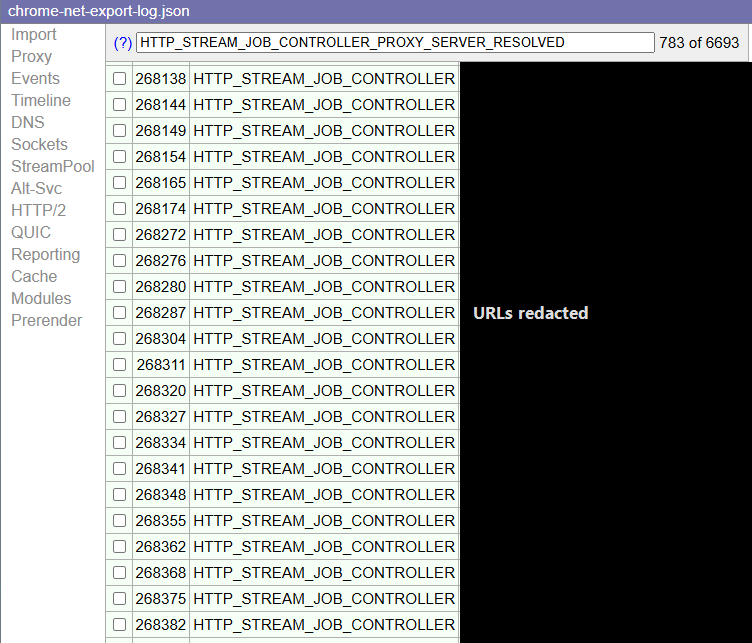
HTTP_STREAM_JOB_CONTROLLER_PROXY_SERVER_RESOLVED — 783
proxy decisions out of 6693 events, from about a minute of normal
browsing. URLs blacked out, which is the point: that column is your
browsing history, and it is in every NetLog you hand to anyone.
Start with the resolved-proxy event for the URL that fails, then compare it to one that works. In my case that comparison was the diagnosis: the failing destination resolved to a decision with no local tunnel in it.
Knowing the verdict still doesn't tell you which rule produced it.
make the PAC file talk
alert() in a PAC file doesn't pop a dialog in Chrome. It
writes a PAC_JAVASCRIPT_ALERT event into the NetLog. So you
can put print statements in the file and read them back.
Take a copy — a copy, on a test host, not the live file — and alert on the inputs:
function FindProxyForURL(url, host) {
    var ip = dnsResolve(host);
    alert("dnsResolve(" + host + ") = " + ip);

    if (ip && isInNet(ip, "10.0.0.0", "255.0.0.0")) {
        alert("BRANCH: rfc1918 -> DIRECT, skipping the tunnel");
        return "DIRECT";
    }

    alert("BRANCH: tunnel");
    return "SOCKS5 127.0.0.1:1080";
}
Recapture, filter to PAC_JAVASCRIPT_ALERT, and you get the
evaluation in order with the values it ran on:
PAC_JAVASCRIPT_ALERT   dnsResolve(portal.corp.example) = 10.14.22.9
PAC_JAVASCRIPT_ALERT   BRANCH: rfc1918 -> DIRECT, skipping the tunnel
Example output, not a real capture.
Two lines and you're done arguing.
Worth knowing:
- Alerts run on every request. Instrument, capture, then take them out. Don't ship an alert-laden PAC to a policy.
- Log values, not labels.
alert("here 3")tells you nothing at 2 a.m. - Alert on the inputs, not just the branches. The branch is usually right. It's what fed the branch that's wrong.
where to put a dnsResolve call
We read PAC files like programs and test them like programs: same file,
same URL, same result. But a file that calls dnsResolve or
myIpAddress isn't a function of the file and the URL. It's
a function of the file, the URL, and the machine it runs on right then.
Chromium's docs recommend dnsResolve() for working out
which network a user is on. It works because it varies.
Split-horizon DNS, a VPN adapter, a different resolver, a stale cache,
being off-network — any of them change the answer.
myIpAddress() is the same: Chrome picks the address it
thinks is best for public routing, which on a multi-homed or VPN'd
machine may not be the interface you assumed.
So when a PAC file breaks for some users:
- Don't start by re-reading the file. Everyone re-reads the file.
- Find what varies per machine:
dnsResolve,dnsResolveEx,myIpAddress,myIpAddressEx, anything built on them. - Capture what those calls returned on an affected machine.
And the structural fix: a rule whose input varies per machine belongs as low in the file as you can put it. Mine was first, which made everything specific and known-good underneath it optional.
two gotchas
The resolver process can die and take your evidence with
it. Desktop Chrome evaluates PAC in a separate process. If it
crashes — third-party DLL injection is a known cause — the NetLog
doesn't report it. Requests come back DIRECT as if your
file said so. If you see DIRECT everywhere and the file
doesn't say that, open Chrome's Task Manager (Shift+Esc) and check the
proxy resolver is alive.
Android is different. Chrome on Android uses the same
resolver but doesn't run it out-of-process, and the
PacProcessor messages you'll find in logcat
come from Android's own PAC implementation, not Chrome's. Don't debug
desktop behavior from a phone.
tl;dr
- Packet captures,
lsof, and DevTools show you what happened after the routing decision.chrome://net-exportshows you the decision. HTTP_STREAM_JOB_CONTROLLER_PROXY_SERVER_RESOLVEDis the verdict.PAC_JAVASCRIPT_ALERTis why.alert()in a PAC file lands in the NetLog. Use it on a copy, log the values, take it out after.- curl doesn't do PAC — but with a full device tunnel its traffic is forwarded anyway, at the OS layer. "Works in curl" isn't a clean test.
- Capture on the affected machine, as the affected user.
- Any rule built on
dnsResolveormyIpAddresswill act differently for someone eventually. Put it low in the file.
trace your own PAC file
The PAC File Tester shows which rule matches a URL and flags the lines whose behavior depends on the machine they run on. Free, runs in your browser.
ack — check your inbox for a confirmation link.
One confirmation email, then you're in. Unsubscribe anytime.